Page 10 - NON-INVASIVE TESTS FOR EVALUATION OF LIVER DISEASE SEVERITY AND PROGNOSIS
P. 10
JOURNAL OF HEPATOLOGY
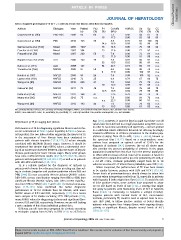
Table 6. Diagnostic performance of TE for F P2 and F4 in chronic liver diseases other than viral hepatitis.
Authors Etiologies Year Patient F≥2 F4 Cut-offs AUROC Se Sp CC
(n) (%) (%) (kPa) (%) (%) (%)
Corpechot et al. [163] PBC-PSC 2006 95 60 7.3 0.92 84 87 75
16 17.3 0.96 93 95 95
Corpechot et al. [164] PBC 2012 103 50 8.8 0.91 67 100 84
14.5 16.9 0.99 93 99 98
Ganne-Carrie et al. [144] Mixed 2006 1007 15 14.6 0.95 79 95 92
Foucher et al. [162] Mixed 2007 354 13 17.6 0.96 77 97 n.a.
Fraquelli et al. [56] Mixed 2007 200 50 7.9 0.86 72 84 n.a.
12 11.9 0.90 91 89 n.a.
Nguyen-Khac et al. [165] ALD 2008 103 75 7.8 0.91 80 91 n.a.
32 19.5 0.92 86 84 n.a.
Nahon et al. [151] ALD 2008 147 54 22.7 0.87 84 83 n.a.
Yoneda et al. [156] NAFLD 2008 97 50 6.6 0.86 88 74 n.a.
9 17.0 0.99 100 97 n.a.
Nobili et al. [157] NAFLD 2008 50 24 7.4 0.99 100 92 n.a.
Lupsor et al. [158] NAFLD 2010 72 25 6.8 0.79 67 84 75
Wong et al. [85] NAFLD 2010 246 41 7.0 0.84 79 76 n.a.
10 10.3 0.95 92 88 n.a.
Gaia et al. [82] NAFLD 2011 72 46 7.0 0.80 76 80 78
12.5 10.5 0.94 78 96 80
Petta et al. [159] NAFLD 2011 169 47 7.25 0.79 69 70 70
Myers et al. [66] NAFLD 2012 75 n.a. 7.8 0.86 84 79 n.a.
n.a. 22.3 0.88 80 91 n.a.
Wong et al. [68] NAFLD 2012 193 45 7.0 0.83 79 64 n.a.
13 10.3 0.89 81 83 n.a.
PBC, primary biliary cirrhosis; PSC, primary sclerosing cholangitis; NAFLD, non-alcoholic fatty liver disease; ALD, alcoholic liver disease.
AUROC, area under ROC curve; Se, sensitivity; Sp, specificity; CC, correctly classified: true positive and negative; n.a., not available.
Performance of TE for staging liver fibrosis ALD [151]. However, it must be kept in mind that these cut-off
values have been defined in a single population using ROC curves
Performances of TE for diagnosing significant fibrosis and cirrho- in order to maximize sensitivity and specificity – and not applied
sis are summarized in Table 5 (viral hepatitis) & Table 6 (non-vi- to a validation cohort. Difference between cut-offs may be simply
ral hepatitis). The two index studies suggesting the interest of TE related to difference in cirrhosis prevalence in the studied pop-
in the assessment of liver fibrosis have been conducted in ulations (ranging from 8% to 54%; Tables 5 and 6), known as
patients with chronic hepatitis C [126,127]. LS values strongly the spectrum bias [16,17]. Based on a meta-analysis, some
correlated with METAVIR fibrosis stages. However, it should be authors have proposed an optimal cut-off of 13 kPa for the
emphasized that despite high AUROC values, a substantial over- diagnosis of cirrhosis [147]. However, the cut-off choice must
lap of LS values was observed between adjacent stages of hepatic also consider the pre-test probability of cirrhosis in the target
fibrosis, particularly for lower fibrosis stages. Many other groups population (varying from less than 1% in the general population
have since confirmed these results [86,124,125,128,129], also in to 10% to 20% in tertiary referral centres). For instance, it has been
patients with hepatitis B [69,124,129–137] as well as in patients shown that in a population with a pre-test probability of 13.8%, at
with HIV-HCV coinfection [138–143]. a cut-off <7 kPa, cirrhosis probability ranged from 0% to 3%
whereas at a cut-off >17 kPa cirrhosis probability was 72% [124].
TE is a reliable method for the diagnosis of cirrhosis in
patients with chronic liver diseases, better at ruling out than rul- When compared, the performances of TE have been shown
ing in cirrhosis (negative and positive predictive values 96% and to be similar between patients with HBV and HCV [135,136].
74%) [144]. TE more accurately detects cirrhosis (AUROC values, Serum levels of aminotransferases should always be taken into
0.80–0.99; correct classification ranging from 80% to 98%) than account when interpreting results from TE, especially in patients
significant fibrosis (AUROC values, 0.65–0.97; correct classifica- with hepatitis B (who might have flares) [152]. To avoid the risk
tion from 57% to 90%) (Table 5 and Table 6). Several meta-ana- of false positive results, some authors have proposed to adapt
lyzes [145–149] have confirmed the better diagnostic TE cut-offs based on levels of ALT [132], a strategy that might
performance of TE for cirrhosis than for fibrosis, with mean not apply to patients with fluctuating levels of ALT or hepatitis
AUROC values of 0.94 and 0.84, respectively [147]. In a recent flares (Table 5). Conversely, in hepatitis e antigen (HBeAg)-
meta-analysis of 18 studies including 2772 HBV patients [150], negative patients with normal levels of ALT, non-invasive
mean AUROC values for diagnosing cirrhosis and significant fibro- methods, particularly TE, could be used as adjunct tools to mea-
sis were 0.93 and 0.86, respectively. However, we are still lacking sure HBV DNA, to follow inactive carriers or better identify
a meta-analysis of data from individual patient data. patients who require liver biopsy (those with ongoing disease
activity or significant fibrosis, despite normal levels of ALT)
Different cut-offs have been proposed for cirrhosis according [130,153–155].
to etiologies ranging from 9.7 kPa in HBV [133] to 22.7 kPa in
Journal of Hepatology 2015 vol. xxx j xxx–xxx 9
Please cite this article in press as: EASL-ALEH Clinical Practice Guidelines: Non-invasive tests for evaluation of liver disease severity and prognosis. J
Hepatol (2015), http://dx.doi.org/10.1016/j.jhep.2015.04.006