Page 28 - EASL POSTGRADUATE COURSE
P. 28
Real time strain elastography
Strain elastography measures the deformation of liver parenchyma following external compression with
a sonographic probe or by cardiac motion. Early studies have demonstrated AUROC values for F2+ of
0.85-0.92. Different processing algorithms between studies and a lack of validation currently limit its
applicability.
Magnetic resonance elastography (MRE)
MRE utilizes an external driver to produce hepatic shear waves that are detected using magnetic
resonance imaging and quantified using post-sequence processing. Multiple areas of signal acquisition
are likely to reduce sampling error. Only one large prospective study of NAFLD patients has been
published demonstrating 2-dimensional MRE to yield high AUROC values for F2+ (0.84), F3+ (0.92)
and F4 (0.89). Accuracy was not impacted by hepatic steatosis [15]. Aside from access and cost issues
these findings need to be replicated in other centres prior to incorporation into clinical practice. In
terms of supersonic shear imaging/real time shear wave elastography, contrast enhanced ultrasound and
magnetic resonance imaging techniques, no studies dedicated to NAFLD patients have currently been
published.
Monitoring fibrosis over time
Little data exists to show that non-invasive markers are dynamic and reflect changes in fibrosis over
time. LSM falls by approximately 1.6 kPa 12 months after bariatric surgery, though this may also reflect
improvement in inflammation [17]. Changes in different serum markers (APRI, ELF, FIB-4) over a
3.5 year period in a population-based cohort of diabetics correlated poorly with each other, suggesting
caution is needed when using different tests to monitor for fibrosis change [1]. Notably, fibrosis typically
progresses slowly in NAFLD (approximately 0.1 stage per year) and monitoring more frequently than
annually is likely to produce false positive readings.
Combination testing
Combining two serum-based tests (e.g. FIB-4 and BARD) or Fibroscan® and a serum-based marker
(FIB-4, NFS) increases accuracy, specificity and PPV, although 30-40% of NAFLD patients will have
indeterminate results for one of the tests [12].
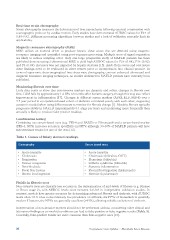
Table 3. Causes of falsely elevated readings.
Elastography Serum based tests
• Acute hepatitis • Acute hepatitis
• Cholestasis • Cholestasis (bilirubin, GGT)
• Respiration • Hemolysis (bilirubin)
• Venous congestion • Gilberts syndrome (bilirubin)
• Beta-blockade • Systemic inflammation
• Focal liver lesions • Recent food ingestion (hyaluronate)
• Recent food ingestion • Exercise (hyaluronate)
Pitfalls in fibrosis tests
Non-invasive tests are typically less accurate in the determination of mid-levels of fibrosis (e.g. Kleiner
or Brunt stage 2), with AUROC levels often between 0.6-0.8 in independent validation studies. In
contrast, models have greater accuracy for determining advanced fibrosis and cirrhosis, with AUROC
levels often >0.9. Due to the relatively low prevalence of cirrhosis, the PPVs of biomarkers is generally
modest. However, the NPVs are generally excellent (>95%), allowing reliable exclusion of cirrhosis.
Interpretation of non-invasive markers should not be performed without considering other clinical and
laboratory findings as co-morbid conditions can lead to false positive or false negative results (Table 3).
Generally, false-positive results are more common than false-negative ones [10].
28 Postgraduate Course Syllabus • Metabolic Liver Disease
Strain elastography measures the deformation of liver parenchyma following external compression with
a sonographic probe or by cardiac motion. Early studies have demonstrated AUROC values for F2+ of
0.85-0.92. Different processing algorithms between studies and a lack of validation currently limit its
applicability.
Magnetic resonance elastography (MRE)
MRE utilizes an external driver to produce hepatic shear waves that are detected using magnetic
resonance imaging and quantified using post-sequence processing. Multiple areas of signal acquisition
are likely to reduce sampling error. Only one large prospective study of NAFLD patients has been
published demonstrating 2-dimensional MRE to yield high AUROC values for F2+ (0.84), F3+ (0.92)
and F4 (0.89). Accuracy was not impacted by hepatic steatosis [15]. Aside from access and cost issues
these findings need to be replicated in other centres prior to incorporation into clinical practice. In
terms of supersonic shear imaging/real time shear wave elastography, contrast enhanced ultrasound and
magnetic resonance imaging techniques, no studies dedicated to NAFLD patients have currently been
published.
Monitoring fibrosis over time
Little data exists to show that non-invasive markers are dynamic and reflect changes in fibrosis over
time. LSM falls by approximately 1.6 kPa 12 months after bariatric surgery, though this may also reflect
improvement in inflammation [17]. Changes in different serum markers (APRI, ELF, FIB-4) over a
3.5 year period in a population-based cohort of diabetics correlated poorly with each other, suggesting
caution is needed when using different tests to monitor for fibrosis change [1]. Notably, fibrosis typically
progresses slowly in NAFLD (approximately 0.1 stage per year) and monitoring more frequently than
annually is likely to produce false positive readings.
Combination testing
Combining two serum-based tests (e.g. FIB-4 and BARD) or Fibroscan® and a serum-based marker
(FIB-4, NFS) increases accuracy, specificity and PPV, although 30-40% of NAFLD patients will have
indeterminate results for one of the tests [12].
Table 3. Causes of falsely elevated readings.
Elastography Serum based tests
• Acute hepatitis • Acute hepatitis
• Cholestasis • Cholestasis (bilirubin, GGT)
• Respiration • Hemolysis (bilirubin)
• Venous congestion • Gilberts syndrome (bilirubin)
• Beta-blockade • Systemic inflammation
• Focal liver lesions • Recent food ingestion (hyaluronate)
• Recent food ingestion • Exercise (hyaluronate)
Pitfalls in fibrosis tests
Non-invasive tests are typically less accurate in the determination of mid-levels of fibrosis (e.g. Kleiner
or Brunt stage 2), with AUROC levels often between 0.6-0.8 in independent validation studies. In
contrast, models have greater accuracy for determining advanced fibrosis and cirrhosis, with AUROC
levels often >0.9. Due to the relatively low prevalence of cirrhosis, the PPVs of biomarkers is generally
modest. However, the NPVs are generally excellent (>95%), allowing reliable exclusion of cirrhosis.
Interpretation of non-invasive markers should not be performed without considering other clinical and
laboratory findings as co-morbid conditions can lead to false positive or false negative results (Table 3).
Generally, false-positive results are more common than false-negative ones [10].
28 Postgraduate Course Syllabus • Metabolic Liver Disease