Page 47 - EASL POSTGRADUATE COURSE
P. 47
peripheral IR) is defined as a lower than expected effect of insulin on glucose disposal by the muscle,
leading to hyperglycemia and compensatory hyperinsulinemia and favouring de novo lipogenesis in the
liver. Peripheral IR is tightly linked to IR in the adipose tissue, i.e. impaired suppression of lipolysis and
increased fatty acid flux from the adipocytes to other organs, including the liver. In the liver, IR leads to
impaired suppression of glucose production and high glucose and insulin levels, thus setting up a vicious
cycle [1, 2]. IS/IR is usually tested on glucose metabolism; however, the ability of insulin to stimulate
glucose uptake (mainly in the skeletal tissue) and suppress its production (mainly in the liver) should
be separately defined.
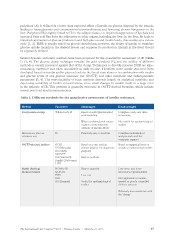
Several dynamic and static methods have been proposed for the quantitative assessment of IR (Table
1) [3, 4]. The glucose clamp technique remains the gold standard [5], and the validity of different
methods is usually measured against that of the clamp. Techniques to directly measure IS/IR are time-
consuming, expensive and often unavailable in daily routine. Therefore, more simple tests have been
developed based on insulin and/or glucose levels in the fasted state alone or in combination with insulin
and glucose levels at oral glucose tolerance test (OGTT) and other metabolic and anthropometric
parameters [3, 4]. The reproducibility of static methods depends largely on analytical variability and
day-to-day variability of insulin concentrations, since small changes in insulin result in a large error
in the estimate of IR. This problem is generally overcome in OGTT-derived formulas, which include
several post-load insulin measurements.
Table 1. Different methods for the quantitative assessment of insulin resistance.
Method Parameter Advantages Disadvantages
Euglycemia clamp Whole-body IS Based on solid physiological Complex, costly and time-
understanding consuming
Intravenous glucose IS When combined with tracers Not useful for epidemiological
tolerance test it gives a comprehensive studies
OGTT-derived indices OGIS estimate of insulin effects
ISI (Matsuda) Relatively easy to perform Complex mathematical
Static (fasting) ISI (Gutt) analysis and need for
measurements SiOGTT Based on a test used in computer support
ISI (Stumvoll) clinical practice for diagnostic Based on empirical basis or
HepIR (DeFronzo) purposes complex mathematical models
LIRI
Easy to perform Low intra- and inter-
HOMA-IR laboratory reproducibility
QUICKI Easy to quantify
FIRI Not applicable to insulin-
IGR Low cost treated or poorly controlled
ISI (Bennett) diabetic patients
Useful for epidemiological
studies Relatively low correlation with
the ‘clamp’
The International Liver Congress™ 2015 • Vienna, Austria • April 22–23, 2015 47
leading to hyperglycemia and compensatory hyperinsulinemia and favouring de novo lipogenesis in the
liver. Peripheral IR is tightly linked to IR in the adipose tissue, i.e. impaired suppression of lipolysis and
increased fatty acid flux from the adipocytes to other organs, including the liver. In the liver, IR leads to
impaired suppression of glucose production and high glucose and insulin levels, thus setting up a vicious
cycle [1, 2]. IS/IR is usually tested on glucose metabolism; however, the ability of insulin to stimulate
glucose uptake (mainly in the skeletal tissue) and suppress its production (mainly in the liver) should
be separately defined.
Several dynamic and static methods have been proposed for the quantitative assessment of IR (Table
1) [3, 4]. The glucose clamp technique remains the gold standard [5], and the validity of different
methods is usually measured against that of the clamp. Techniques to directly measure IS/IR are time-
consuming, expensive and often unavailable in daily routine. Therefore, more simple tests have been
developed based on insulin and/or glucose levels in the fasted state alone or in combination with insulin
and glucose levels at oral glucose tolerance test (OGTT) and other metabolic and anthropometric
parameters [3, 4]. The reproducibility of static methods depends largely on analytical variability and
day-to-day variability of insulin concentrations, since small changes in insulin result in a large error
in the estimate of IR. This problem is generally overcome in OGTT-derived formulas, which include
several post-load insulin measurements.
Table 1. Different methods for the quantitative assessment of insulin resistance.
Method Parameter Advantages Disadvantages
Euglycemia clamp Whole-body IS Based on solid physiological Complex, costly and time-
understanding consuming
Intravenous glucose IS When combined with tracers Not useful for epidemiological
tolerance test it gives a comprehensive studies
OGTT-derived indices OGIS estimate of insulin effects
ISI (Matsuda) Relatively easy to perform Complex mathematical
Static (fasting) ISI (Gutt) analysis and need for
measurements SiOGTT Based on a test used in computer support
ISI (Stumvoll) clinical practice for diagnostic Based on empirical basis or
HepIR (DeFronzo) purposes complex mathematical models
LIRI
Easy to perform Low intra- and inter-
HOMA-IR laboratory reproducibility
QUICKI Easy to quantify
FIRI Not applicable to insulin-
IGR Low cost treated or poorly controlled
ISI (Bennett) diabetic patients
Useful for epidemiological
studies Relatively low correlation with
the ‘clamp’
The International Liver Congress™ 2015 • Vienna, Austria • April 22–23, 2015 47